From data to decisions: exploring operational thinking
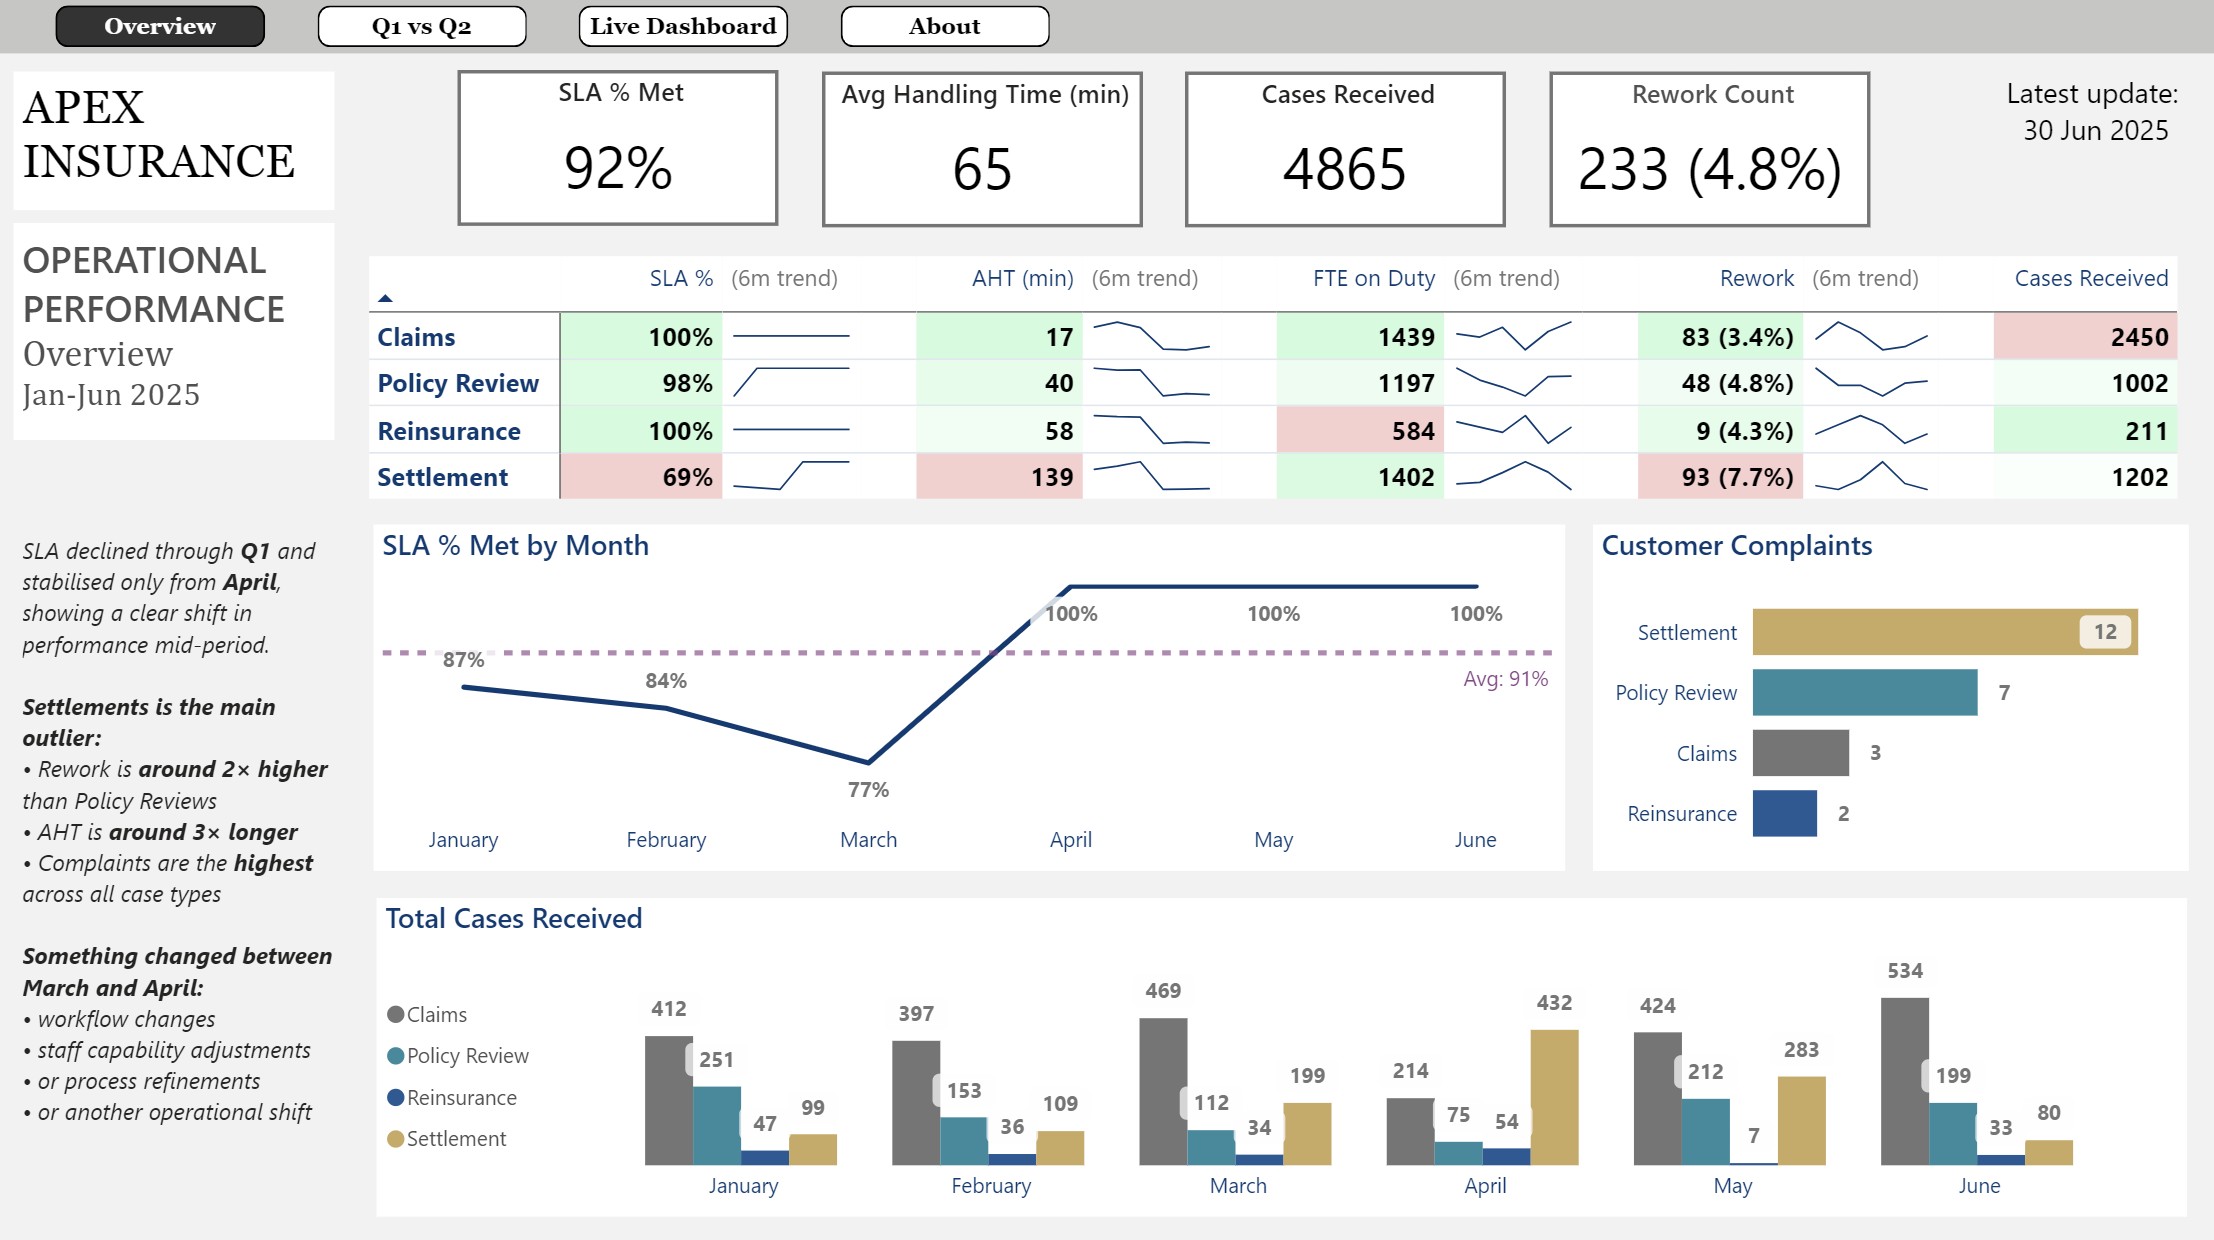
A walkthrough of how operational data becomes actionable insight through structure and clarity, bridging MI reporting and BI dashboards.
This is my personal portfolio, focused on data analytics, visual design, and business insight.
A walkthrough of how operational data becomes actionable insight through structure and clarity, bridging MI reporting and BI dashboards.
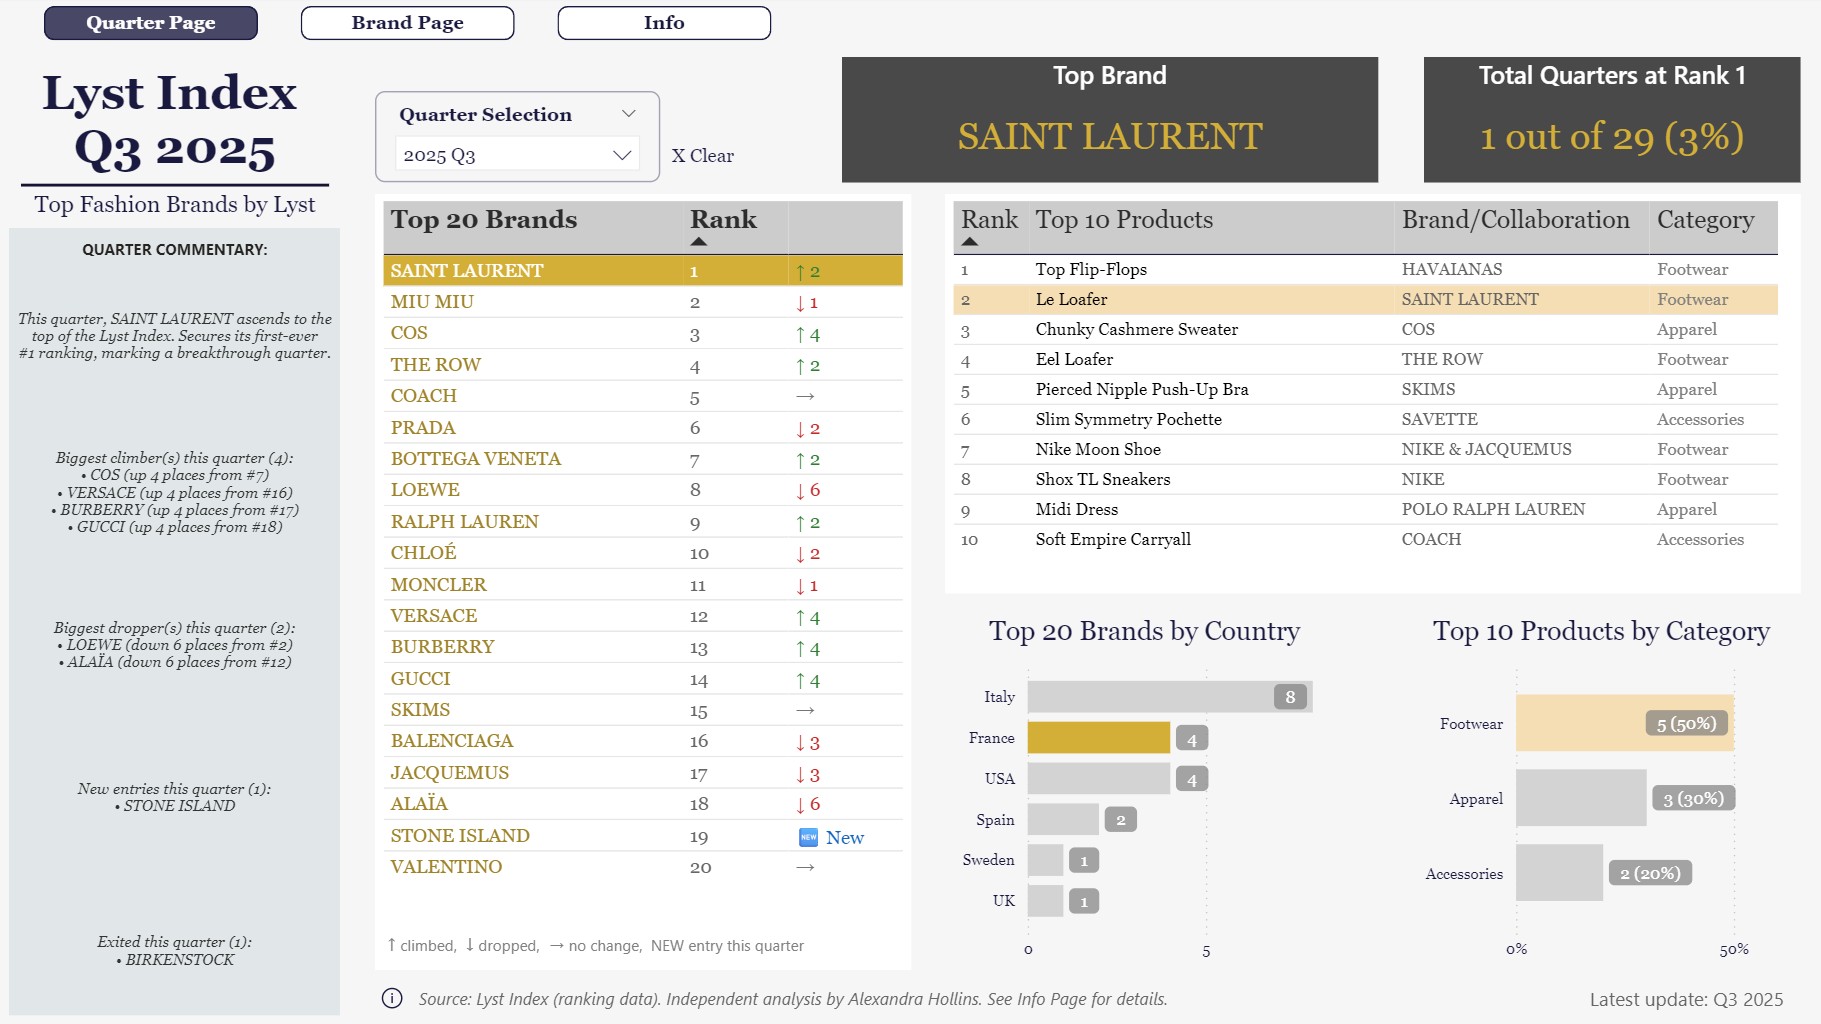
A walkthrough of how I turned the Lyst Index into a Power BI report that surfaces the story behind the rankings.
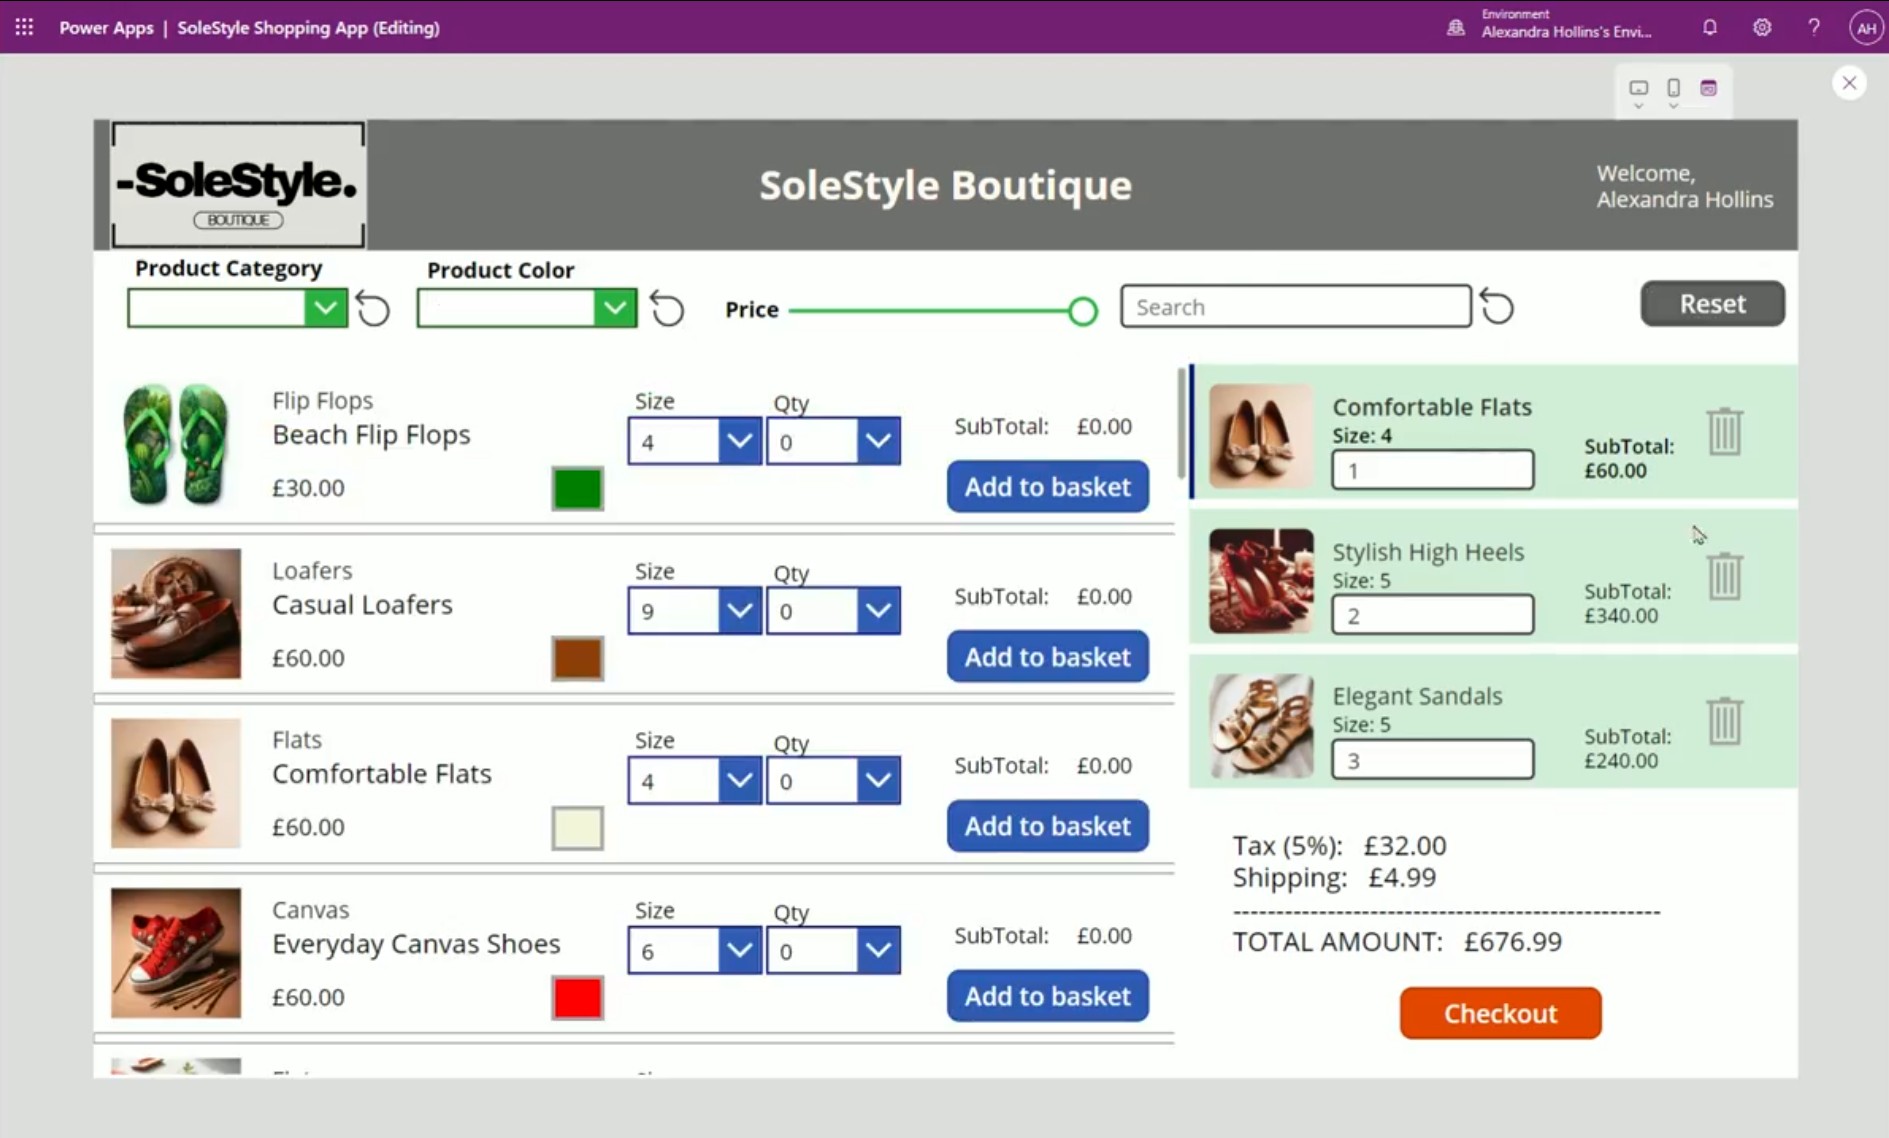
Microsoft Power Up Program: Integrated Power Platform solution for a fictional shoe boutique.
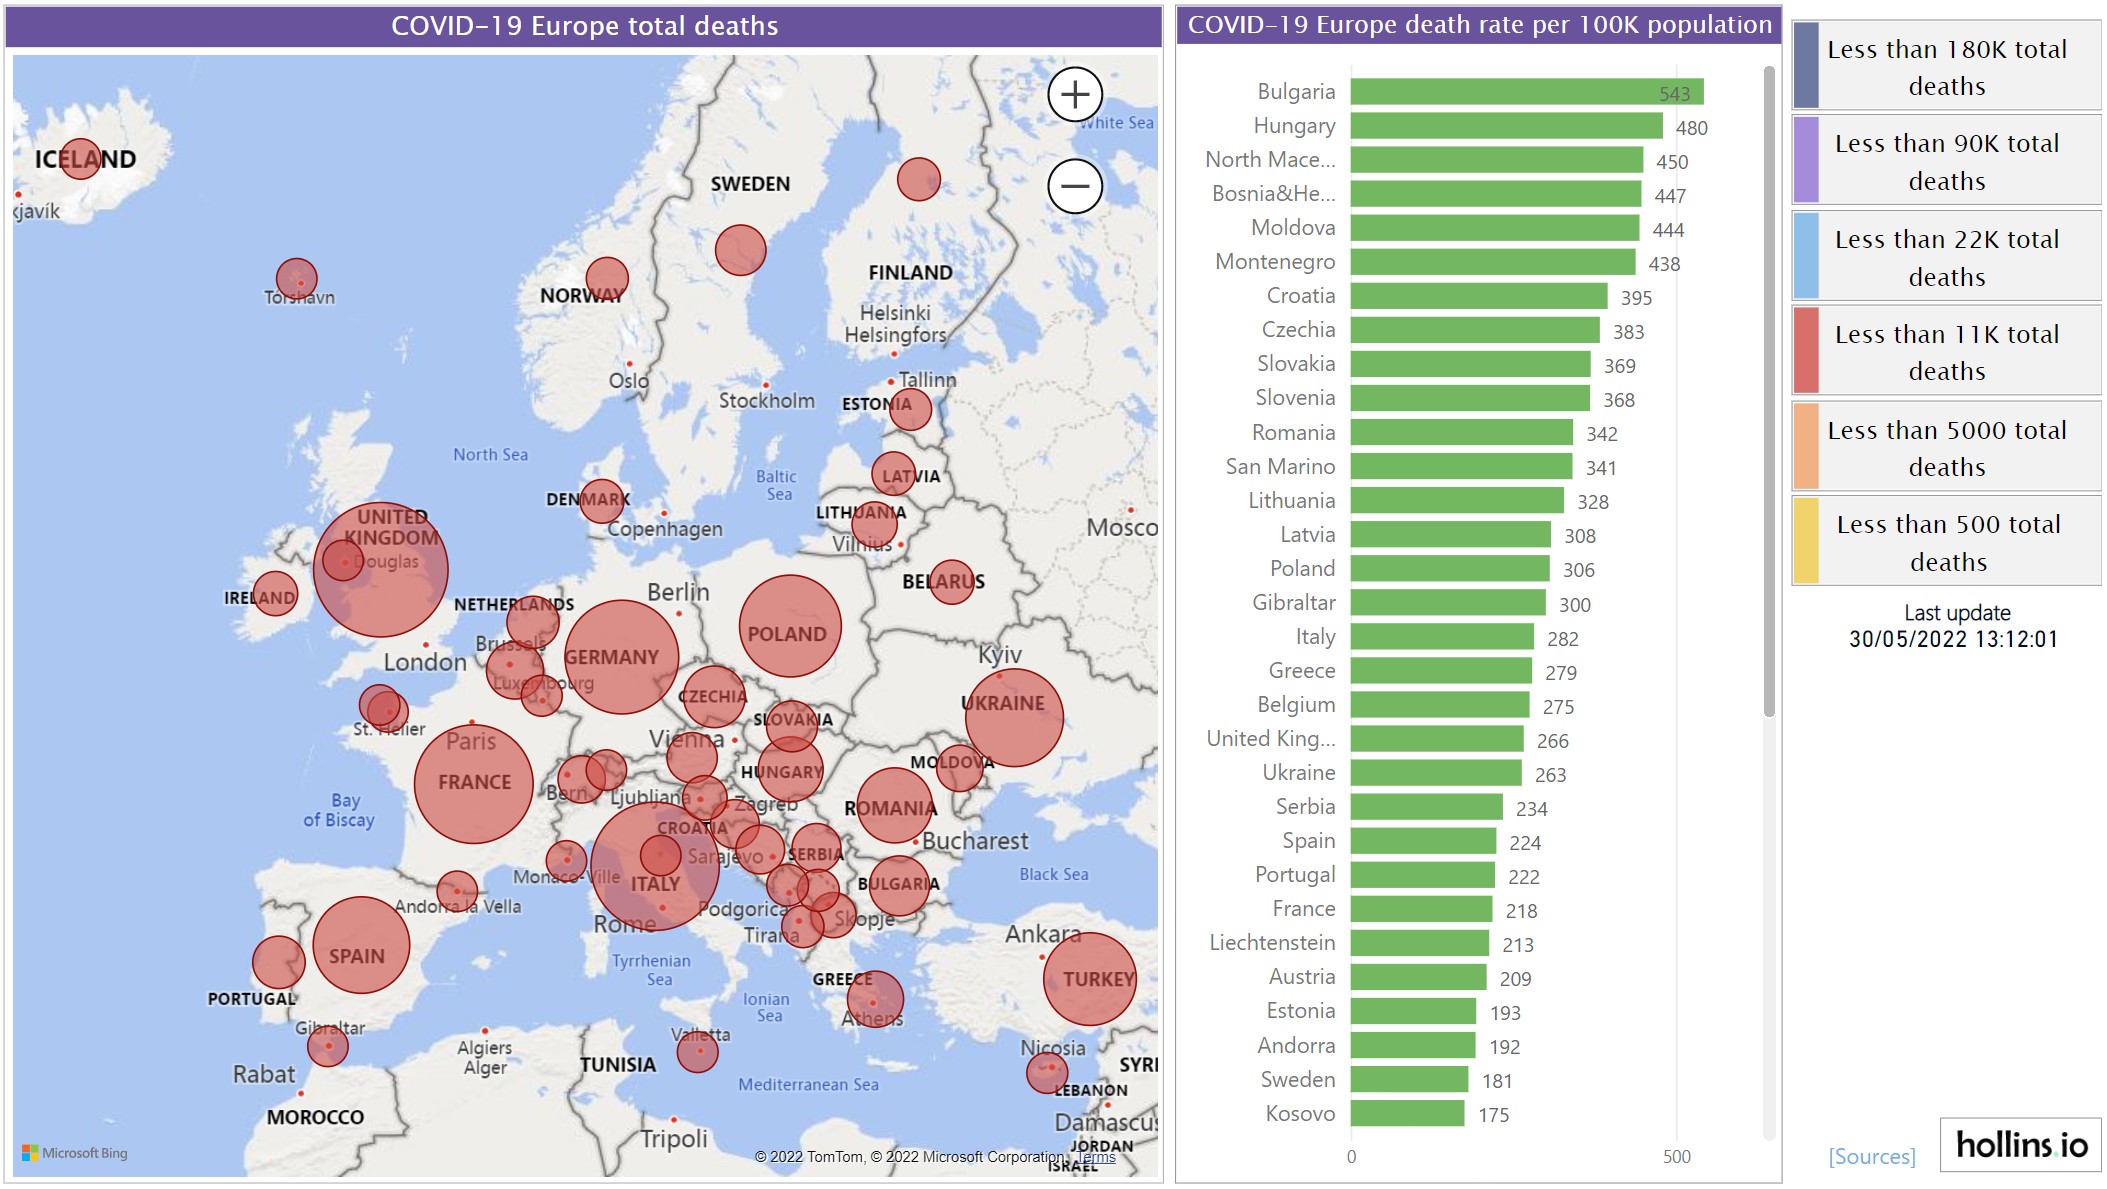
My second Power BI project covering COVID-19 deaths across Europe with mapping, comparative visuals, and death rates.
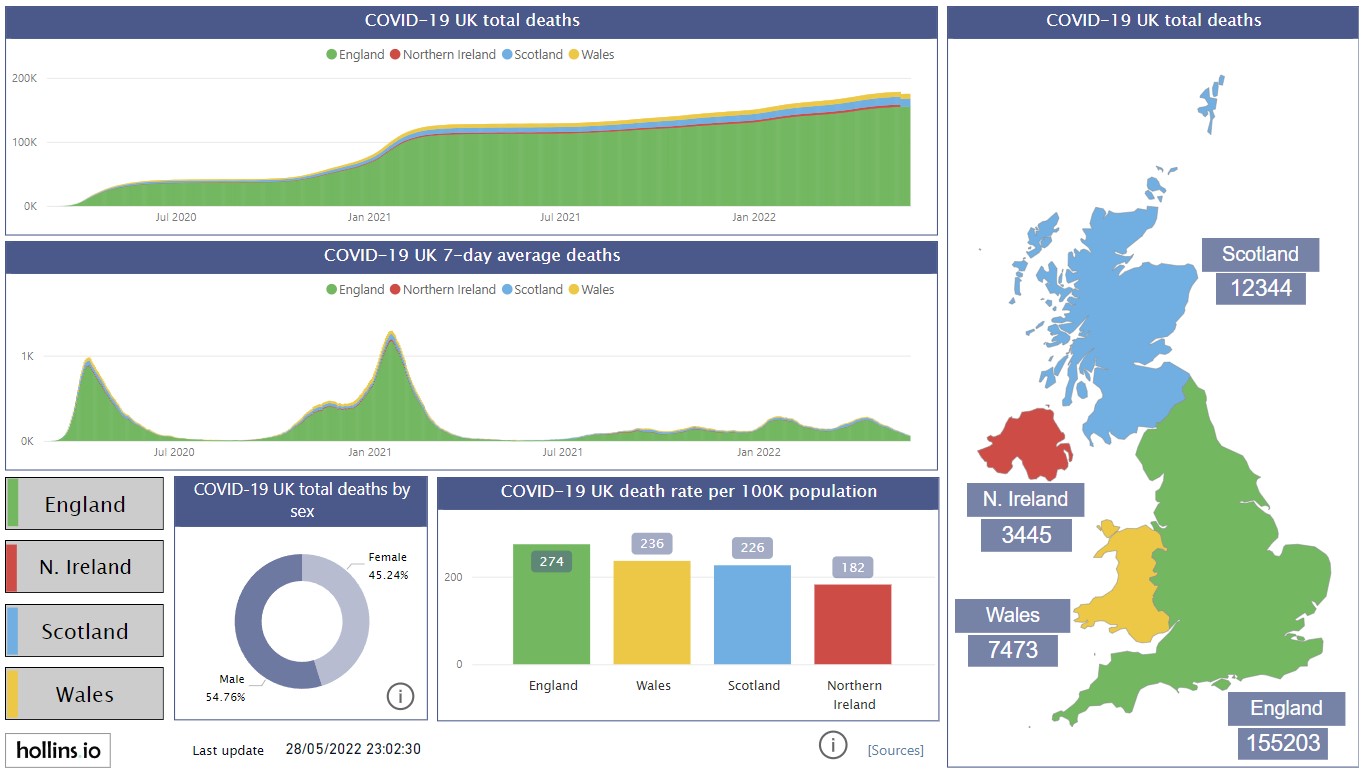
My first Power BI project from 2020 visualizing COVID-19 deaths in the UK with cumulative data, trends, and country-level details.