From rankings to insights: designing a fashion intelligence report
You can view the full interactive Power BI report here → Lyst Index.
1. Purpose & Framework: Why I Built This Report
The Lyst Index is a quarterly ranking of fashion brands and products generating the most global interest, based on shopping activity and social media engagement. It provides a consistent view of how brand positioning over time and forms the foundation for this report.
- Source - The Lyst Index provides the baseline dataset.
- Goal - Bring the information together in one place to reveal the bigger picture.
- Focus - Data, structure, and clarity: showing how Power BI can turn detail into something simple to explore.
- Original work - While the source is the Lyst Index, the report, data model, and framework are my own design, created to tell the story behind the numbers.
2. Clarity & Structure: How the Report Tells the Story
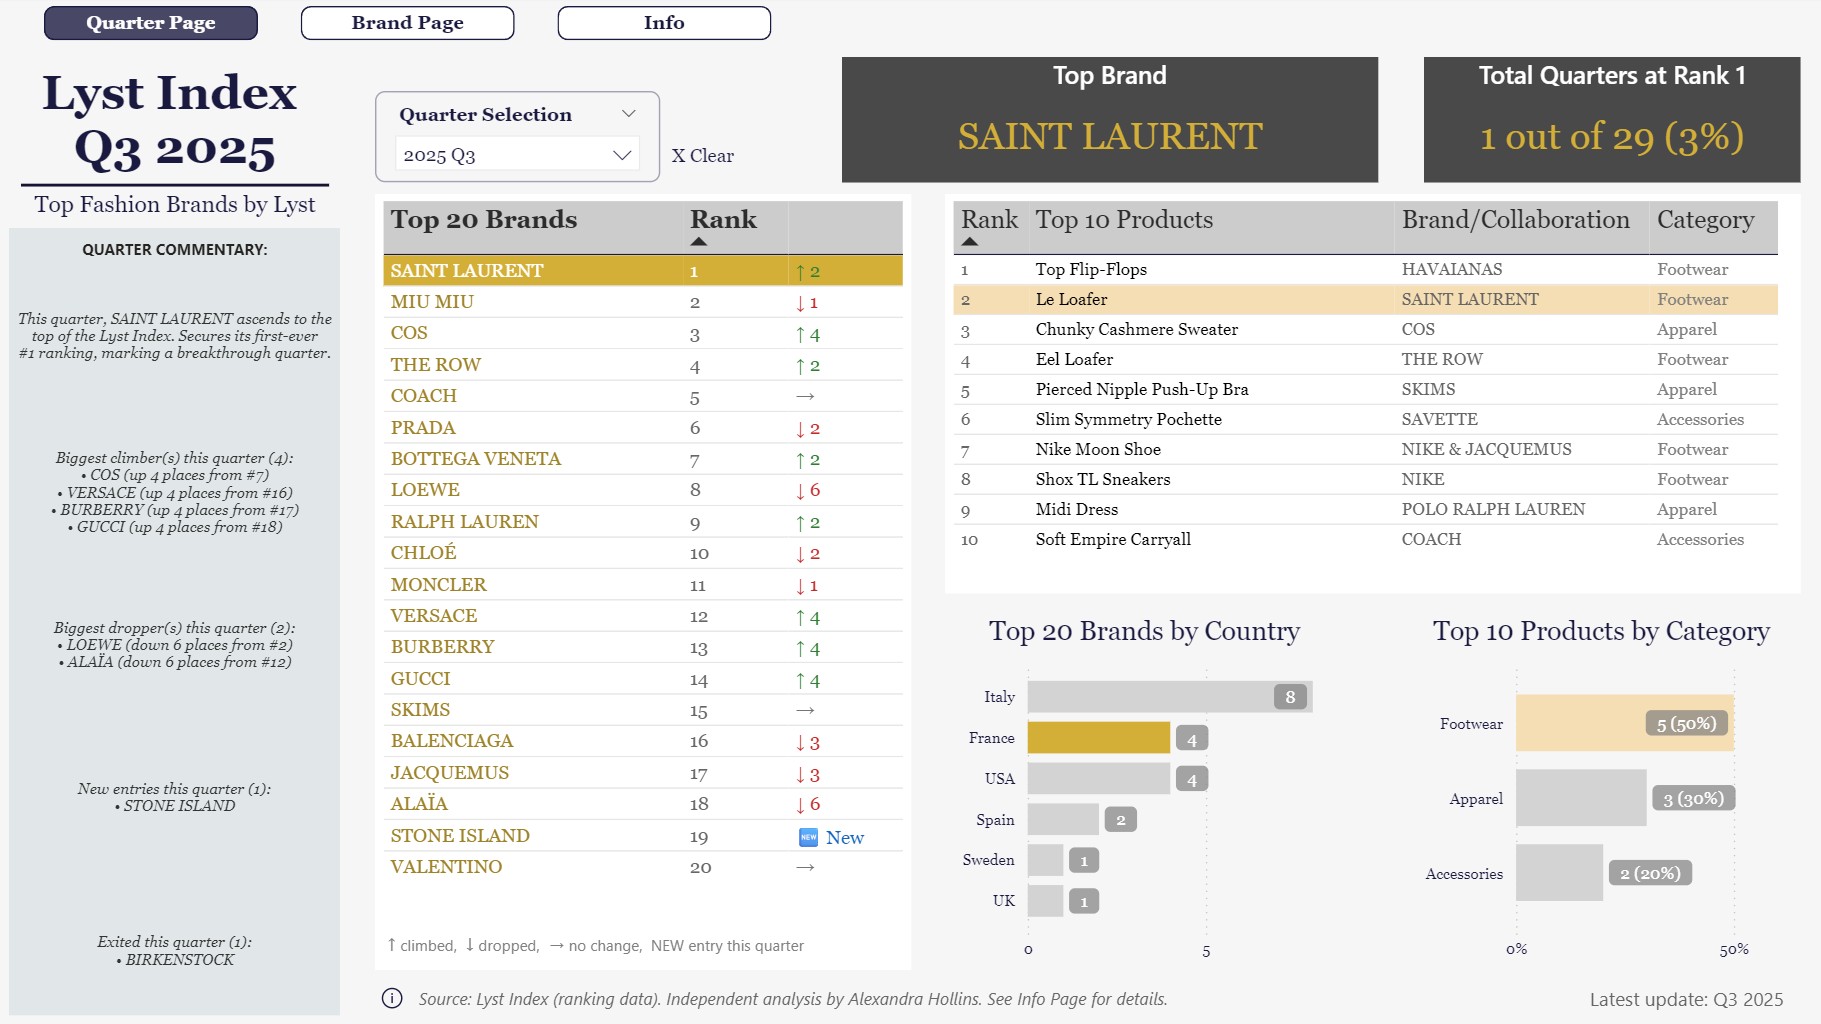
The first page is designed to be read at a glance. Rankings lead, commentary adds context, and supporting visuals remain secondary, providing depth without distraction. Every element has a purpose; nothing is included for decoration alone.
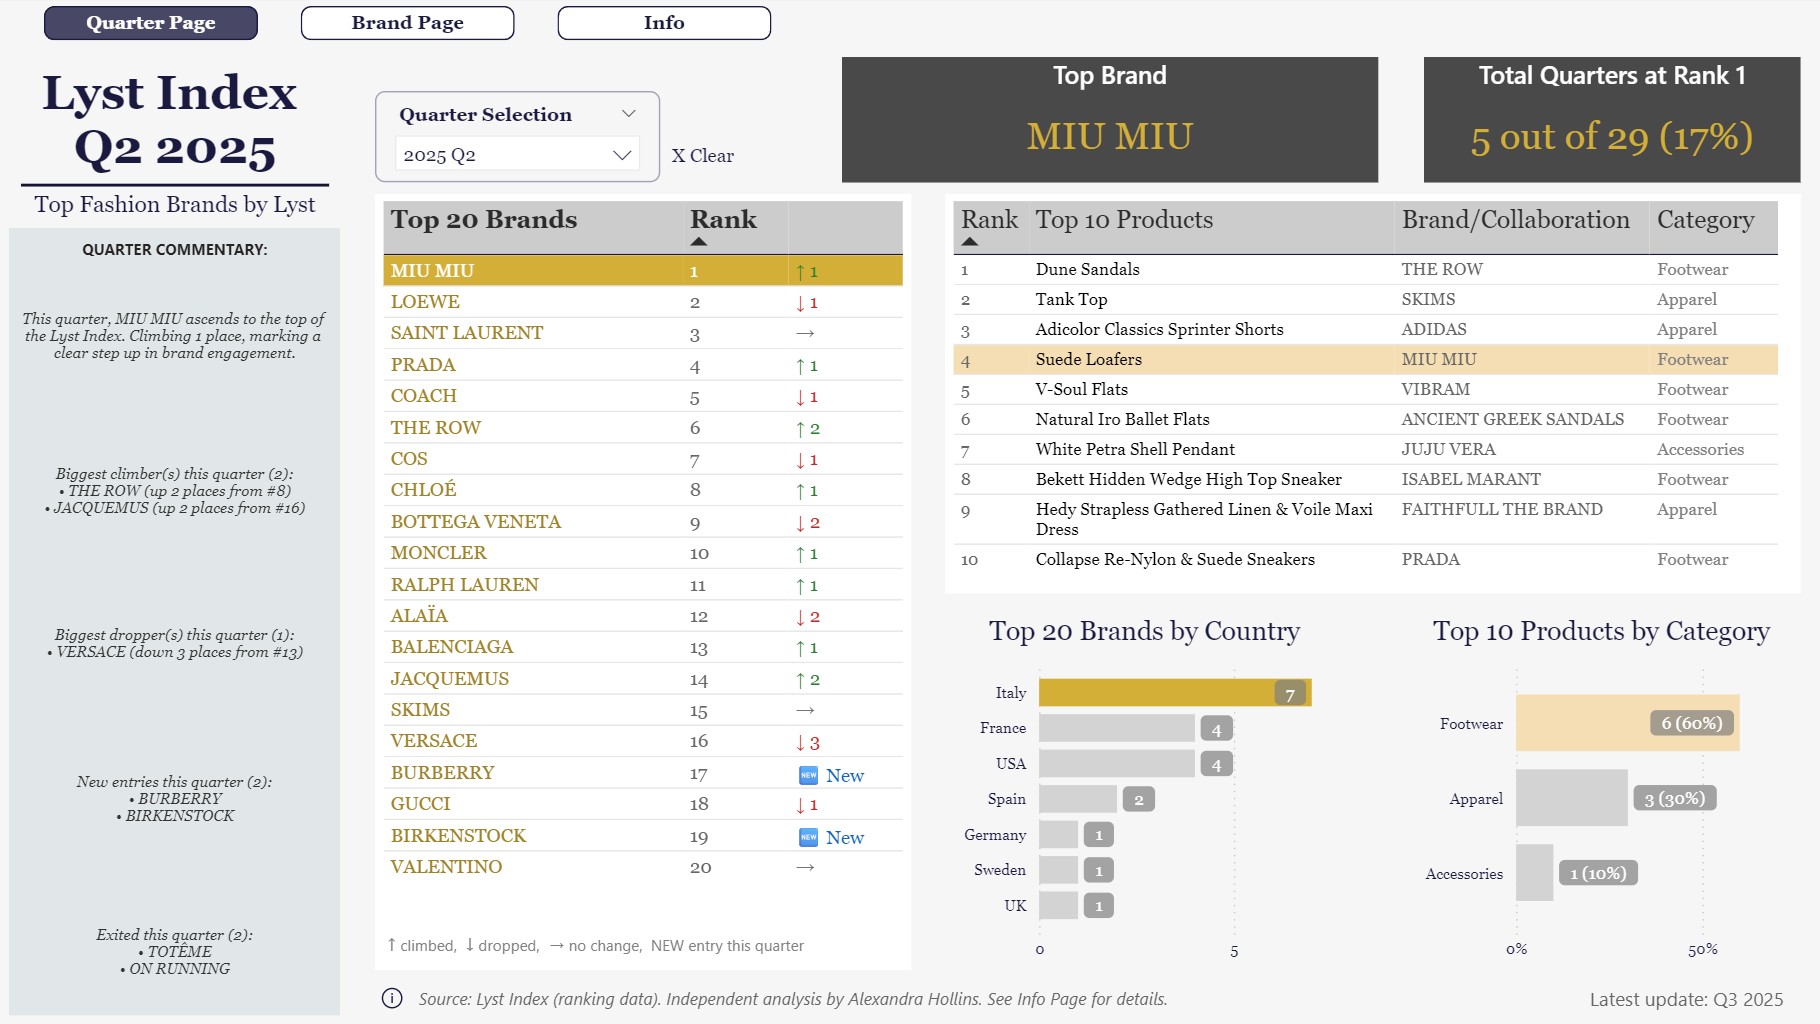
- Layout choices - Rankings anchor the reader, with commentary positioned to explain shifts.
- Supporting visuals - Charts and graphics provide depth but stay in the background.
- Data model - Relationships between rankings, brands, and collaborations ensure the story holds together.
- Measures - Custom calculations that track brand movement and changes over time, keeping results consistent across the report.
3. Illustrative Example: The Ranking Table
The design principles come together most clearly in the ranking table, where brand movement is shown directly alongside positions. The story is visible at a glance, without extra explanation.
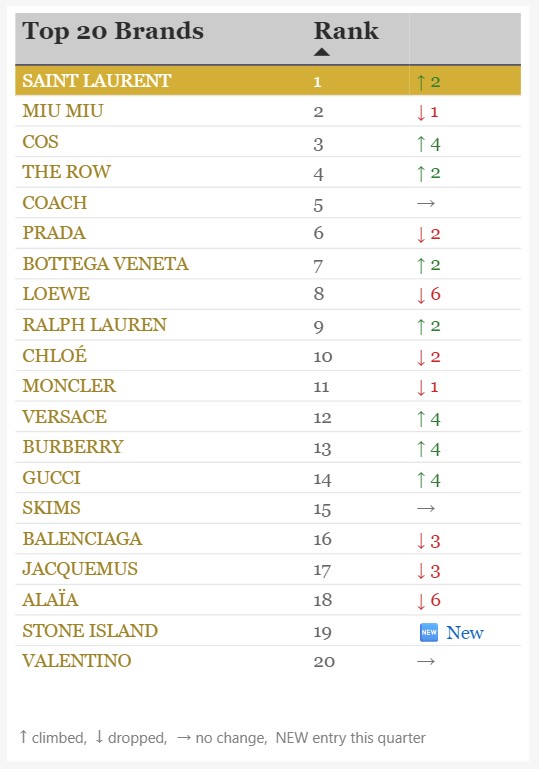
- RankMovement measure - A custom calculation merges arrows and values into one field.
- Instant clarity - Gains, drops, and new entries are visible immediately.
- Business value - Decision‑makers can scan the Top 20 in seconds, spotting momentum without digging into detail.
- Design principle in action - Technical logic works quietly in the background, while the front‑end experience stays simple and intuitive.
4. Business Impact: Turning Data Into Decisions
The report is not only about rankings; it is designed to help leaders understand why brands are moving and what drives those changes. Commentary and product table add the depth needed to move from numbers to insight.
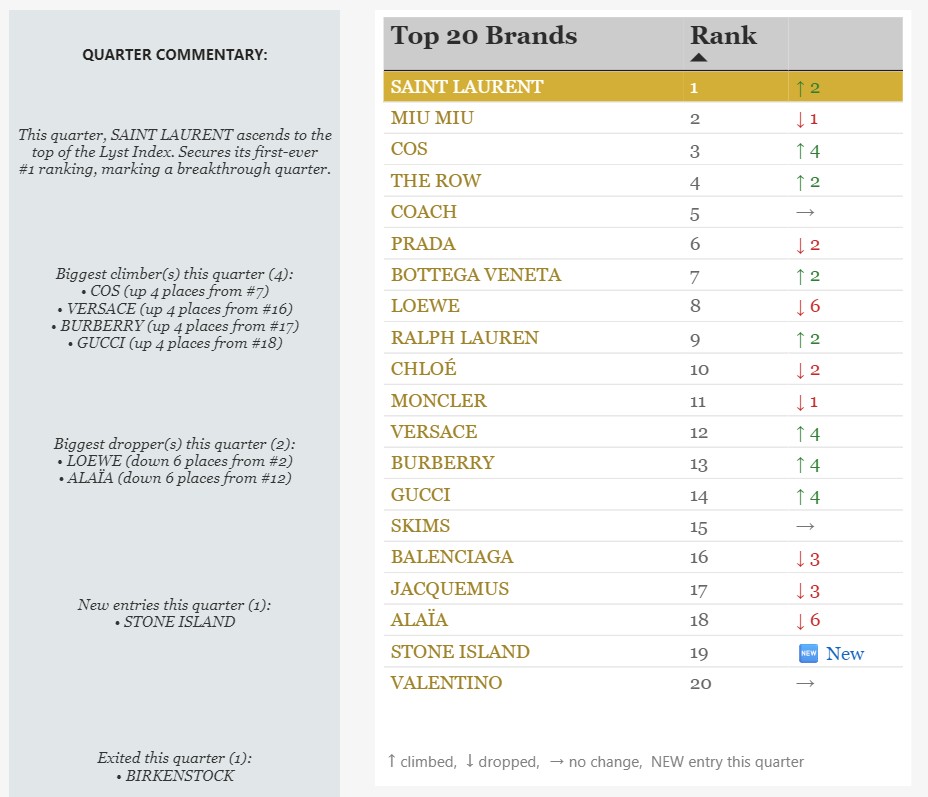
- Commentary panel - Highlights the stories behind shifts, such as collaborations, capsule launches, or sudden drops.
- Product table - Connects brand movement to specific items generating demand, showing which products shape the rankings.
- Decision support - Together, these elements allow leaders to spot momentum, understand context, and act quickly on emerging trends.
5. Challenges: Decisions That Shaped the Report
Building the report meant tackling messy realities in the data and making deliberate choices about what to show, simplify, or leave out. Each challenge refined the framework.
- Collaboration handling - Splitting collaborations into single brands, aligning them back to the core list, and ensuring consistent counting.
- Multiple tables - Structuring separate layers for rankings, products, and metadata so brand movement and product demand could be shown together without breaking the logic.
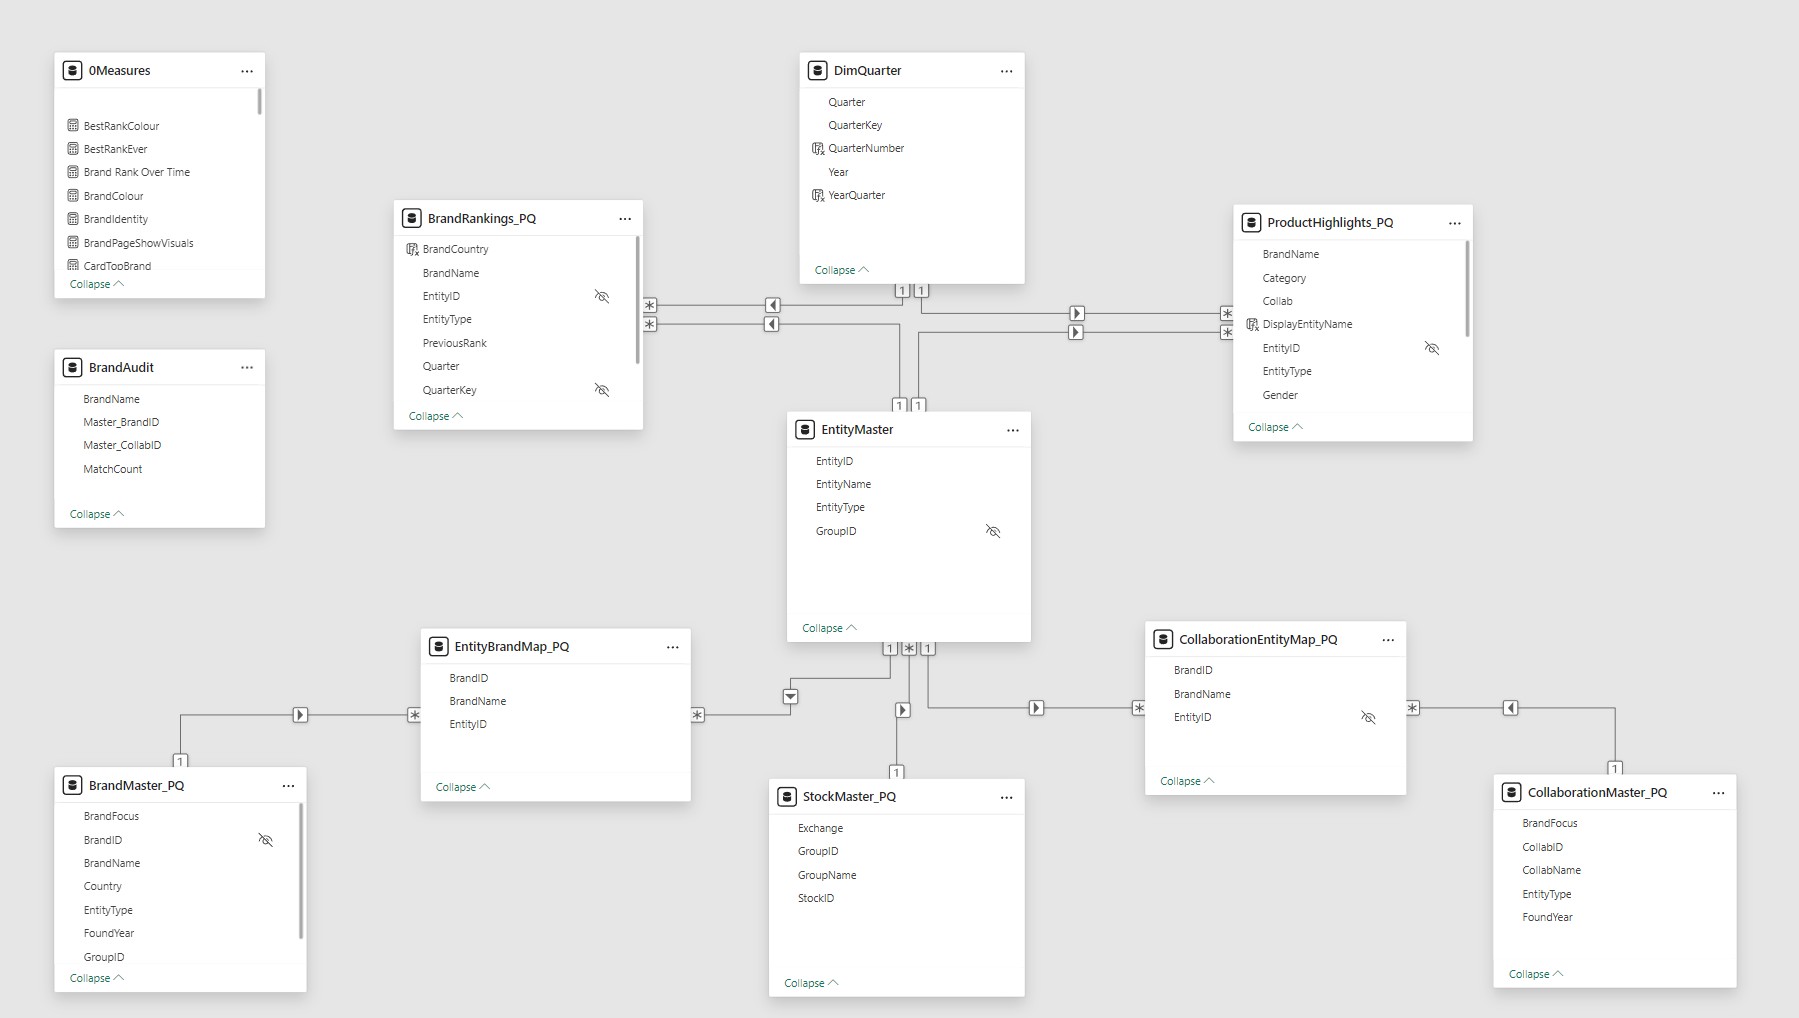
- Framework design - Supporting structures manage relationships between brands, collaborations, and products, giving the model a clean backbone for consistency.
- Highlighting choices - Deciding which elements deserved space on Page 1 (Top 20, commentary, product highlights) and which details to hold back for deeper pages.
- Editorial balance - Keeping Page 1 simple enough to scan, while ensuring the technical work behind collaborations, measures, and supporting tables still shaped the story.
6. Conclusion: Where the Report Stands and Where It Can Go
The report is ready to use now and will stay current as new rankings are released.
- Current state - Rankings, commentary, and products are already aligned, giving a clear and consistent narrative.
- Guided pages - The framework is structured so readers can move seamlessly from headline rankings to deeper brand and product insights.
- Quarterly updates - The report will be refreshed as new rankings are published, keeping the view up to date.
- Additional pages - Additional pages are planned as the dataset grows, with scope and timing to be shaped by the data and opportunities that arise.
These technical notes outline the mechanics behind the framework, how each page is structured, the measures that drive it, and the supporting logic that keeps it consistent.
Appendix: Technical Notes
This appendix outlines the mechanics behind the framework, how each page is structured, the measures that drive it, and the supporting logic that keeps it consistent.
Page 1 - Quarter Page
Summarizes the latest Lyst Index results, including the Top 20 brands, commentary insights, and key product highlights. Measures support dynamic filtering, rank movement tracking, and contextual storytelling across visuals and commentary.
Ranking Table
These measures drive the Top 20 brand ranking table, including rank movement and color logic.
- RankMovement - Shows direction (↑ ↓ → 🆕) and size of rank change.
RankMovement =
VAR CurrentQ = [SelectedOrLatestQuarter]
VAR Brand    = MAX ( BrandRankings_PQ[BrandName] )
VAR CurrentRank =
    CALCULATE (
        MAX ( BrandRankings_PQ[Rank] ),
        BrandRankings_PQ[QuarterKey] = CurrentQ,
        BrandRankings_PQ[BrandName] = Brand
    )
VAR PrevRank =
    CALCULATE (
        MAX ( BrandRankings_PQ[PreviousRank] ),
        BrandRankings_PQ[QuarterKey] = CurrentQ,
        BrandRankings_PQ[BrandName] = Brand
    )
VAR Change = PrevRank - CurrentRank
VAR Arrow =
    SWITCH (
        TRUE(),
        ISBLANK ( PrevRank ), "🆕",
        Change > 0, "↑",
        Change < 0, "↓",
        ""
    )
VAR DisplayChange =
    SWITCH (
        TRUE(),
        ISBLANK ( PrevRank ), " New",
        Change = 0, "→",
        " " & ABS ( Change )
    )
RETURN
Arrow & DisplayChange
- RankMovementColor - Applies colour logic for up, down, new, or no change.
RankMovementColor =
VAR CurrentQ = [SelectedOrLatestQuarter]
VAR Brand    = MAX ( BrandRankings_PQ[BrandName] )
VAR CurrentRank =
    CALCULATE (
        MAX ( BrandRankings_PQ[Rank] ),
        BrandRankings_PQ[QuarterKey] = CurrentQ,
        BrandRankings_PQ[BrandName] = Brand
    )
VAR PrevRank =
    CALCULATE (
        MAX ( BrandRankings_PQ[PreviousRank] ),
        BrandRankings_PQ[QuarterKey] = CurrentQ,
        BrandRankings_PQ[BrandName] = Brand
    )
VAR Change = PrevRank - CurrentRank
RETURN
SWITCH (
    TRUE(),
    ISBLANK ( PrevRank ), "#1565C0",
    Change > 0, "#2E7D32",
    Change < 0, "#C62828",
    "#757575"
)
Top Cards
These measures generate dynamic labels and titles for the quarter overview cards.
- TitleLatestQuarter - Generates a dynamic page title.
TitleLatestQuarter =
VAR qKey = [SelectedOrLatestQuarter]
VAR qNum = CALCULATE( MAX( DimQuarter[Quarter] ), DimQuarter[QuarterKey] = qKey )
VAR yNum = CALCULATE( MAX( DimQuarter[Year] ), DimQuarter[QuarterKey] = qKey )
RETURN "Lyst Index Q" & qNum & " " & yNum
- LatestQuarterLabel - Creates a readable label for the latest update.
LatestQuarterLabel =
VAR LatestQ =
    CALCULATE (
        MAX ( BrandRankings_PQ[QuarterKey] ),
        REMOVEFILTERS ( BrandRankings_PQ )
    )
VAR Year =
    CALCULATE (
        MAX ( BrandRankings_PQ[Year] ),
        BrandRankings_PQ[QuarterKey] = LatestQ,
        REMOVEFILTERS ( BrandRankings_PQ )
    )
VAR Quarter =
    CALCULATE (
        MAX ( BrandRankings_PQ[Quarter] ),
        BrandRankings_PQ[QuarterKey] = LatestQ,
        REMOVEFILTERS ( BrandRankings_PQ )
    )
RETURN
    "Latest update: Q" & Quarter & " " & Year
Quarter Context Measures
These measures anchor visuals to the selected or latest quarter, ensuring consistent filtering and labelling.
- IsCurrentQuarter – Flags whether a brand or product row belongs to the selected/latest quarter. Used for conditional formatting and visibility logic.
- LatestQuarter – Returns the most recent quarter key from the dataset. Used as a fallback when no slicer selection is made.
- SelectedOrLatestQuarter – Returns the slicer-selected quarter, or defaults to the latest if none is selected. Ensures visuals always show valid data.
Commentary Panel
These measures generate narrative insights for the quarter, including top brands, climbers, and new entries.
- CommentaryTopBrand - Narrates the story of the #1 brand.
CommentaryTopBrand =
VAR q = [SelectedOrLatestQuarter]
VAR brand =
    CALCULATE (
        SELECTEDVALUE ( BrandRankings_PQ[BrandName] ),
        FILTER ( BrandRankings_PQ, BrandRankings_PQ[QuarterKey] = q && BrandRankings_PQ[Rank] = 1 )
    )
VAR prevRank =
    CALCULATE (
        MAX ( BrandRankings_PQ[PreviousRank] ),
        FILTER ( BrandRankings_PQ, BrandRankings_PQ[BrandName] = brand && BrandRankings_PQ[QuarterKey] = q )
    )
VAR delta = prevRank - 1
VAR TrendCount =
    CALCULATE (
        COUNTROWS (
            FILTER (
                BrandRankings_PQ,
                BrandRankings_PQ[BrandName] = brand &&
                BrandRankings_PQ[QuarterKey] < q &&
                BrandRankings_PQ[PreviousRank] > BrandRankings_PQ[Rank]
            )
        )
    )
VAR HasBeenTopBefore =
    CALCULATE (
        COUNTROWS ( BrandRankings_PQ ),
        FILTER (
            ALL ( BrandRankings_PQ ),
            BrandRankings_PQ[BrandName] = brand &&
            BrandRankings_PQ[Rank] = 1 &&
            BrandRankings_PQ[QuarterKey] < q
        )
    )
RETURN
    IF (
        ISBLANK ( brand ),
        "",
        "This quarter, " & brand & " ascends to the top of the Lyst Index. " &
        IF (
            HasBeenTopBefore = 0,
            "Secures its first-ever #1 ranking, marking a breakthrough quarter.",
            IF (
                delta > 0,
                "Climbing " & delta & IF ( delta = 1, " place", " places" ) & ", " &
                IF (
                    TrendCount >= 2,
                    "the brand continues its multi-quarter rise in momentum.",
                    IF (
                        delta = 1,
                        "marking a clear step up in brand engagement.",
                        IF (
                            delta <= 3,
                            "indicating a solid lift in brand engagement.",
                            "signalling a significant surge in consumer demand."
                        )
                    )
                ),
                "Retains the top spot, reflecting stable consumer demand and brand strength."
            )
        )
    )
- CommentaryBiggestClimbers - Identifies brands with the largest upward movement.
CommentaryBiggestClimbers =
VAR q = [SelectedOrLatestQuarter]
VAR ranked =
    ADDCOLUMNS(
        FILTER(
            BrandRankings_PQ,
            BrandRankings_PQ[QuarterKey] = q &&
            NOT ISBLANK(BrandRankings_PQ[PreviousRank])
        ),
        "Change", BrandRankings_PQ[PreviousRank] - BrandRankings_PQ[Rank]
    )
VAR maxChange = MAXX(ranked, [Change])
VAR topClimbers =
    FILTER(ranked, [Change] = maxChange && [Change] > 0)
VAR brandList =
    CONCATENATEX(
        topClimbers,
        "• " & BrandRankings_PQ[BrandName] &
        " (up " & [Change] & IF([Change]=1," place"," places") &
        " from #" & BrandRankings_PQ[PreviousRank] & ")",
        UNICHAR(10)
    )
RETURN
    IF(
        ISBLANK(brandList), "",
        "Biggest climber(s) this quarter (" & COUNTROWS(topClimbers) & "):" &
        UNICHAR(10) & brandList
    )
- CommentaryBiggestDroppers - Identifies brands with the largest downward movement. Example output: "Biggest dropper(s) this quarter (1): • VERSACE (down 3 places from #13)."
- CommentaryNewEntry - Flags brands entering the Index for the first time or returning after a previous absence. Example output: "New entries this quarter (2): • BURBERRY • BIRKENSTOCK."
- CommentaryExitedBrands - Flags brands that dropped out of the Index. Example output: "Exited this quarter (2): • TOTEME • ON RUNNING."
Products Table
These measures support the Top 10 products table, including row highlighting and quarter filtering.
- LegacyQuarterNote - Adds contextual note about pre-2022 separate rankings.
LegacyQuarterNote =
IF (
    MIN ( ProductHighlights_PQ[Year] ) < 2022
        || ( MIN ( ProductHighlights_PQ[Year] ) = 2022 && MIN ( ProductHighlights_PQ[Quarter] ) <= 2 ),
    "Until Q2 2022, Lyst published separate Top 10 products for Women and Men." & UNICHAR(10) &
    "From Q3 2022 onward, a unified Top 10 ranking is used.",
    " "
)
- ProductRowColour - Highlights rows tied to the Top 1 brand.
ProductRowColour =
VAR _Top1 = [Top1BrandName]
VAR _EntityID = MAX ( ProductHighlights_PQ[EntityID] )
VAR _BrandsForEntity =
    CALCULATETABLE (
        VALUES ( EntityBrandMap_PQ[BrandName] ),
        EntityBrandMap_PQ[EntityID] = _EntityID
    )
RETURN
IF (
    CONTAINS ( _BrandsForEntity, EntityBrandMap_PQ[BrandName], _Top1 ),
    "#F5DEB3",
    BLANK()
)
- ProductIsCurrentQuarter – Flags whether a product belongs to the selected/latest quarter supporting filtering by quarter.
Products Chart
These measures calculate product counts and category shares for the selected quarter.
- CategoryLabelQuarterPage - Generates label text for each bar: count and percentage.
CategoryLabelQuarterPage =
[ProductCountCategory] & " (" &
FORMAT ( [ProductPctCategory], "0%" ) & ")"
- ProductCountCategory - Counts products in the selected category.
ProductCountCategory =
VAR SelectedQ = [SelectedOrLatestQuarter]
RETURN
CALCULATE (
    COUNTROWS ( ProductHighlights_PQ ),
    ProductHighlights_PQ[QuarterKey] = SelectedQ,
    KEEPFILTERS ( VALUES ( ProductHighlights_PQ[Category] ) )
)
- ProductPctCategory - Calculates percentage of products in the category.
ProductPctCategory =
VAR SelectedQ = [SelectedOrLatestQuarter]
VAR _CategoryCount =
    CALCULATE (
        COUNTROWS ( ProductHighlights_PQ ),
        ProductHighlights_PQ[QuarterKey] = SelectedQ,
        KEEPFILTERS ( VALUES ( ProductHighlights_PQ[Category] ) )
    )
VAR _TotalCount =
    CALCULATE (
        COUNTROWS ( ProductHighlights_PQ ),
        ProductHighlights_PQ[QuarterKey] = SelectedQ,
        REMOVEFILTERS ( ProductHighlights_PQ[Category] )
    )
RETURN
DIVIDE ( _CategoryCount, _TotalCount )
- ProductCategoryColour - Highlights bars where the Top 1 brand appears.
ProductCategoryColour =
VAR TopBrand = [Top1BrandName]
VAR SelectedQ = [SelectedOrLatestQuarter]
VAR ProductsInCategory =
    CALCULATETABLE (
        VALUES ( ProductHighlights_PQ[EntityID] ),
        ProductHighlights_PQ[QuarterKey] = SelectedQ,
        KEEPFILTERS ( VALUES ( ProductHighlights_PQ[Category] ) )
    )
VAR BrandsInCategory =
    CALCULATETABLE (
        VALUES ( EntityBrandMap_PQ[BrandName] ),
        EntityBrandMap_PQ[EntityID] IN ProductsInCategory
    )
VAR HasTopBrand =
    CALCULATE (
        COUNTROWS ( FILTER ( BrandsInCategory, EntityBrandMap_PQ[BrandName] = TopBrand ) ),
        FILTER (
            ProductHighlights_PQ,
            ProductHighlights_PQ[QuarterKey] = SelectedQ &&
            ProductHighlights_PQ[Rank (product)] <= 10
        )
    )
RETURN
IF ( HasTopBrand > 0, "#F5DEB3", "#D3D3D3" )
Countries Chart
These measures summarize the country distribution of Top 20 brands and highlight the #1 brand's origin.
- CountryBarColour - Highlights the country of the Top 1 brand.
CountryBarColour =
IF (
    MAX ( BrandRankings_PQ[BrandCountry] ) = [Top1BrandCountry],
    "#D4AF37",
    "#D3D3D3"
)
- CountryCountTop20 - Counts Top 20 brands in the selected quarter.
CountryCountTop20 =
VAR SelectedQ = [SelectedOrLatestQuarter]
RETURN
    CALCULATE (
        COUNTROWS ( BrandRankings_PQ ),
        BrandRankings_PQ[QuarterKey] = SelectedQ,
        BrandRankings_PQ[Rank] <= 20
    )
- Top1BrandCountry - Returns the country of the #1 brand.
Top1BrandCountry =
CALCULATE (
    MAX ( BrandRankings_PQ[BrandCountry] ),
    FILTER (
        BrandRankings_PQ,
        BrandRankings_PQ[Rank] = 1 &&
        BrandRankings_PQ[QuarterKey] = [SelectedOrLatestQuarter]
    )
)
Page 2 - Brand Page
Provides a deep dive into brand performance beyond the Top 20, including rank history, metadata, collaborations, and product presence. Measures support brand-level filtering, conditional formatting, and narrative generation across cards, charts, and commentary.
Brand Quarter Line Chart
These measures support the brand rank-over-time chart, including rank markers and axis scaling.
- BrandRankOverTime - Returns the brand’s rank for each quarter, based on slicer selection or defaulting to the top brand.
BrandRankOverTime =
VAR _Brand =
    COALESCE (
        SELECTEDVALUE ( BrandRankings_PQ[BrandName] ),
        CALCULATE (
            MAXX (
                TOPN (
                    1,
                    FILTER (
                        ALL ( BrandRankings_PQ ),
                        BrandRankings_PQ[QuarterKey] = [LatestQuarter]
                    ),
                    BrandRankings_PQ[Rank], ASC
                ),
                BrandRankings_PQ[BrandName]
            )
        )
    )
RETURN
CALCULATE (
    MIN ( BrandRankings_PQ[Rank] ),
    KEEPFILTERS ( TREATAS ( { _Brand }, BrandRankings_PQ[BrandName] ) )
)
- QuarterDivider - Returns the maximum rank value across all quarters.
QuarterDivider =
VAR _MaxRank =
    CALCULATE (
        MAX ( BrandRankings_PQ[Rank] ),
        ALL ( BrandRankings_PQ )
    )
RETURN
_MaxRank
- Rank1Marker - Flags quarters where the selected brand reached #1.
Rank1Marker =
VAR BrandOnce =
    COALESCE (
        SELECTEDVALUE ( BrandRankings_PQ[BrandName] ),
        CALCULATE (
            MAXX (
                TOPN (
                    1,
                    FILTER (
                        ALL ( BrandRankings_PQ ),
                        BrandRankings_PQ[QuarterKey] = [LatestQuarter]
                    ),
                    BrandRankings_PQ[Rank], ASC
                ),
                BrandRankings_PQ[BrandName]
            )
        )
    )
VAR QuarterPoint = SELECTEDVALUE ( DimQuarter[QuarterKey] )
VAR RankAtPoint =
    CALCULATE (
        MIN ( BrandRankings_PQ[Rank] ),
        KEEPFILTERS ( TREATAS ( { BrandOnce }, BrandRankings_PQ[BrandName] ) ),
        KEEPFILTERS ( TREATAS ( { QuarterPoint }, BrandRankings_PQ[QuarterKey] ) )
    )
RETURN
IF ( HASONEVALUE ( DimQuarter[QuarterKey] ) && RankAtPoint = 1, 1 )
Top Cards
These measures generate brand-level summary cards, including latest rank, best rank, and country.
- LatestRankWithQuarter - Generates a label showing the brand’s latest rank and quarter (e.g. “Rank 1 (2025 Q3)”).
LatestRankWithQuarter =
VAR _Brand = [SelectedOrDefaultBrand]
VAR _LatestQuarter =
    CALCULATE (
        MAX ( BrandRankings_PQ[QuarterKey] ),
        KEEPFILTERS ( TREATAS ( { _Brand }, BrandRankings_PQ[BrandName] ) )
    )
VAR _Rank =
    CALCULATE (
        MIN ( BrandRankings_PQ[Rank] ),
        KEEPFILTERS ( TREATAS ( { _Brand }, BrandRankings_PQ[BrandName] ) ),
        BrandRankings_PQ[QuarterKey] = _LatestQuarter
    )
VAR _QuarterLabel =
    CALCULATE (
        MAX ( DimQuarter[YearQuarter] ),
        DimQuarter[QuarterKey] = _LatestQuarter
    )
RETURN
"Rank " & _Rank & " (" & _QuarterLabel & ")"
- BrandIdentity - Returns the brand name and country in a unified label.
BrandIdentity =
VAR _Brand   = [SelectedOrDefaultBrand]
VAR _Country = [SelectedBrandCountry]
RETURN
_Brand & UNICHAR(10) & "(" & _Country & ")"
- BestRankColour - Applies gold highlight if the brand has ever reached #1.
BestRankColour =
VAR _Brand = [SelectedOrDefaultBrand]
VAR _BestRank =
    CALCULATE (
        MIN ( BrandRankings_PQ[Rank] ),
        KEEPFILTERS ( TREATAS ( { _Brand }, BrandRankings_PQ[BrandName] ) )
    )
RETURN
IF ( _BestRank = 1, "#C9A227", "#FFFFFF" )
Commentary Panel
These measures generate brand-level narrative insights, including age, ownership, tenure, and collaborations.
- CommentaryBrandAge - Calculates brand age based on founding year.
CommentaryBrandAge =
VAR brand = [SelectedOrDefaultBrand]
VAR foundYear =
    CALCULATE (
        MAX ( BrandMaster_PQ[FoundYear] ),
        BrandMaster_PQ[BrandName] = brand
    )
VAR currentYear = YEAR(TODAY())
VAR age = currentYear - foundYear
RETURN
brand & " was founded in " & foundYear &
    ", making it " & age & " years old in " & currentYear & "."
-
CommentaryGroupOwnership - Summarizes group affiliation and peer brands. Example output: "MIU MIU belongs to Prada S.p.A., alongside Prada."
-
CommentaryIndexTenure - Calculates how often the brand has appeared in the Index since debut. Example output: "LOEWE has featured in 25 of 29 Index editions (86%) since debuting in Q3 2019."
-
CommentaryProductPresence - Summarizes product highlight frequency and split between independent and collaborative releases. Example output: "BALENCIAGA has been highlighted 14 times across Top 10 product rankings, representing 3% of all entries. This includes 12 independent releases and 2 collaborations."
-
CommentaryCollabPartners - Identifies collaboration partners from Top 10 product rankings.
CommentaryCollabPartners =
VAR brand = [SelectedOrDefaultBrand]
VAR CollabRows =
    FILTER (
        ProductHighlights_PQ,
        SEARCH(brand, ProductHighlights_PQ[DisplayEntityName], 1, 0) > 0 &&
        ProductHighlights_PQ[Collab] = "Collab"
    )
VAR PartnerTable =
    ADDCOLUMNS (
        GENERATE (
            SELECTCOLUMNS(CollabRows, "Entity", ProductHighlights_PQ[DisplayEntityName]),
            VAR entity = [Entity]
            VAR parts = SUBSTITUTE(entity, " & ", "|")
            RETURN
                SELECTCOLUMNS (
                    ADDCOLUMNS (
                        GENERATESERIES(1, PATHLENGTH(parts)),
                        "Name", PATHITEM(parts, [Value])
                    ),
                    "Partner", TRIM([Name])
                )
        ),
        "CleanPartner", [Partner]
    )
VAR FilteredPartners =
    FILTER (
        PartnerTable,
        [CleanPartner] <> brand
    )
VAR PartnerList =
    CONCATENATEX (
        DISTINCT(SELECTCOLUMNS(FilteredPartners, "Name", [CleanPartner])),
        [Name],
        ", ",
        [Name],
        ASC
    )
VAR CollabCount = COUNTROWS(CollabRows)
RETURN
IF (
    CollabCount = 0,
    brand & " has no collaborations. All its Top 10 products are independent releases.",
    brand & " has collaborated with " & PartnerList & " in Top 10 product rankings."
)
Products Table
These measures support the brand-specific products table, including entity mapping and display logic.
- ProductShowRowsSelectedBrand - Flags whether a product row belongs to the selected brand, based on entity-brand mapping.
ProductShowRowsSelectedBrand =
VAR CurrentEntity = MAX ( ProductHighlights_PQ[EntityID] )
VAR ActiveBrand   = [SelectedOrDefaultBrand]
VAR BrandsForEntity =
    CALCULATETABLE (
        VALUES ( EntityBrandMap_PQ[BrandName] ),
        EntityBrandMap_PQ[EntityID] = CurrentEntity
    )
RETURN
IF ( ActiveBrand IN BrandsForEntity, 1, 0 )
- DisplayEntityName - Calculated column that returns the display name for each product entity, including both solo brands and collaborations.
DisplayEntityName =
UPPER ( RELATED ( EntityMaster[EntityName] ) )
Product Chart
These measures calculate product counts and category shares for the selected brand.
- CategoryCountSelectedBrand - Counts Top 10 products tied to the selected brand within each category, including both solo and collaborative releases.
CategoryCountSelectedBrand =
VAR ActiveBrand = [SelectedOrDefaultBrand]
VAR ValidEntityIDs =
    CALCULATETABLE (
        VALUES ( EntityBrandMap_PQ[EntityID] ),
        EntityBrandMap_PQ[BrandName] = ActiveBrand
    )
RETURN
CALCULATE (
    COUNTROWS ( ProductHighlights_PQ ),
    ProductHighlights_PQ[EntityID] IN ValidEntityIDs
)
- CategoryTotalSelectedBrand - Returns total Top 10 products tied to the selected brand across all categories.
CategoryTotalSelectedBrand =
VAR ActiveBrand = [SelectedOrDefaultBrand]
VAR ValidEntityIDs =
    CALCULATETABLE (
        VALUES ( EntityBrandMap_PQ[EntityID] ),
        EntityBrandMap_PQ[BrandName] = ActiveBrand
    )
RETURN
CALCULATE (
    COUNTROWS ( ProductHighlights_PQ ),
    ProductHighlights_PQ[EntityID] IN ValidEntityIDs,
    ALL ( ProductHighlights_PQ[Category] )
)
- CategoryPctSelectedBrand - Calculates percentage share of products in each category for the selected brand.
CategoryPctSelectedBrand =
DIVIDE ( [CategoryCountSelectedBrand], [CategoryTotalSelectedBrand], 0 )
- CategoryLabelBrandPage - Generates label text for each bar: count and percentage.
CategoryLabelBrandPage =
[CategoryCountSelectedBrand] & " (" &
FORMAT ( [CategoryPctSelectedBrand], "0%" ) & ")"
- CategoryShare - Calculates the brand’s share of products within the selected category across all brands.
CategoryShare =
VAR _Brand = [SelectedOrDefaultBrand]
RETURN
DIVIDE (
    CALCULATE (
        COUNTROWS ( ProductHighlights_PQ ),
        ProductHighlights_PQ[BrandName] = _Brand
    ),
    CALCULATE (
        COUNTROWS ( ProductHighlights_PQ ),
        ALL ( ProductHighlights_PQ ),
        ProductHighlights_PQ[Category] = SELECTEDVALUE ( ProductHighlights_PQ[Category] )
    )
)
More will be added as the report continues to develop.